Creative Industries Economic Results Assessment™
CIERA™ 2024 Results
Results for calendar year 2024 estimates, published on the web in March 2026. Visit the industries’ individual profile pages for details by segment.
About CIERA™
CIERA™, the Creative Industries Economic Results Assessment, is Creative BC’s proprietary tool producing annual impact estimates for the province’s creative sector since 2019. The tool is an ongoing collaboration between Creative BC, Deetken Insight, and Notio Media.
The five core storytelling industries* contribute GDP, jobs, and output as they create content for mass consumption and global distribution. A sixth category—multi-industry creators and services—reflects their interdependence and adds extra economic and ecosystem value, making the creative sector greater than the sum of its parts.
All results exclude any government subsidies received by each industry.
CIERA™ is built entirely on Statistics Canada datasets, developed and tested in British Columbia with review by BC Stats, and continues to evolve through ongoing consultation with Canadian Heritage, which produces the Provincial and Territorial Culture Indicators. It has been adopted by other provinces for their creative sectors and even extended in one jurisdiction to include arts and crafts—demonstrating its scalability for measuring economic impacts across the creative sector and beyond.
*(books, interactive digital media, magazines, motion picture, music + sound recording)
Recent Impacts
Total GDP
$8.3B
Direct Output
88,618
Total Jobs
Total GDP CAGR
2015-2024
Est. People
About CIERA™
Why we built CIERA™
Reporting Cycle
With the first CIERA™ indicators published for 2019 and contextualized in Creative BC’s 2019/20 Impact Report, CIERA™ indicators are published annually, measuring economic impacts in a repeatable, comparable, and comprehensive manner. The focus of the results is on GDP and Jobs, as these are the most meaningful in terms of economic impact.
CIERA™ Key Indicators
The focus of the results of CIERA™ is on GDP and Jobs, as these are the most meaningful in terms of economic impact.
Quality is assured in the following ways:
- Utilizing datasets exclusively from Statistics Canada that are designed to enable this kind of specialized research & analysis
- Interviews with Statistics Canada analysts to confirm acceptable use of the data
- Validation of results against related Statistics Canada datasets
- An extensive external review of the methodology by a BC Stats expert
- Regular maintenance and enhancements for continual alignment
Select key limitations include (see full methodology for detail):
- Statistics Canada Methodological Changes – results should ideally not be viewed as an exact time series, because Statistics Canada’s measurement methodologies may change from time to time and historical results are not always updated. When methodologies are changed by Statistics Canada, it will produce results based on the new methodology implemented for the most current year and may or may not use a process called “back-casting” to update previous years with the revised methodology so as to offer insight into trends.
- Public Data Measures Hours, Not People – Job measurement is not ideal for gig work, as it provides insight into full-time and equivalent jobs based on a traditional approach to hours worked, as opposed to counting the number of people working and sharing those hours. Real-time industry insights and research can be used to complement CIERA™ Jobs indicators. (see more below)
- Statistics Canada data “lags” by two years – for example, 2019 actuals are published by Statistics Canada in 2021 (typically in November of each year). Therefore, benchmarks and statisticians’ estimations are required for one additional year to bridge lagging indicators to the previous calendar year for relevance to the industry.
The following are the Key Indicators measured:
- Total GDP – this figure is the sum of direct, indirect and induced contributions to the economy; it represents labour and profit contributions by the industry primarily, but excludes expenditures on supplies and services. Indirect and induced show economic contributions within the province only. GDP figures are net of any government subsidies received by the industry.
- Direct Output – this figure is the direct impact (no indirect or induced are added) and represents labour and profit contributions to GDP plus expenditures on supplies and services.
- Total Jobs – this figure is the sum of direct, indirect and induced numbers and it represents traditional FTE and PT equivalent jobs. It represents work, but not workers, and currently has limited ability to measure gig work. It must be noted that the creative industries include many people with gig work that is not easily assessed using this traditional measurement approach model. Statistics Canada recognizes the importance of gig work and acknowledges that it is most prevalent in the arts, culture, recreation and sport industries. Furthermore, B.C. has the highest share of gig workers in the country – in 2016, 8.7% of male workers and 10.7% of women workers in B.C. are engaged in the gig economy.
CIERA™ estimates three types of economic impacts:
- The direct impact reflects the immediate economic activity of those businesses within the creative industries.
- The indirect impact reflects the demand from creative industries for inputs from other industries. The indirect impact is cumulative and includes transactions going all the way back to the beginning of the supply chain.
- The induced impact reflects the economic activity that arises as a result of industry workers, involved in either direct or indirect activity, spending part of their wages and salaries on other goods and services.
Note: CIERA™ makes adjustments to account for “own direct” activity; that is, supplier activity from the same industry. Not adjusting for “own indirect” activity leads to a form of double-counting between direct, indirect and induced effects within a given industry.
For comparability with other industries and reports, it is important to identify whether Total or Direct impacts are referenced.
Key to Annual Tools and Resources
Each year, these items will be published as resources for transparency and leverage of CIERA™ insights:
- CIERA™: standard methodology with annual notations reflecting changes to Statistics Canada or enhancements to the CIERA™ approach
- CIERA™ Tables: GDP, Output, and Jobs
- IOIC / NAICS Codes: Mapping spreadsheets
- Context: The annual CIERA™ Impact Report, in which the CIERA™ figures were contextualized
Creative Industries Served by CIERA™
Motion Picture – creating, producing and marketing creative products in the forms of feature films, TV series, documentaries and factual content, this industry leverages B.C. talent including: above-the-line creators (narrative-influencing, creative direction); below-the-line film crew; animation, VFX and post production (part of the creative tech workforce); and those in industry-agent fields, from supply and service companies to film festival staff.
Interactive + Digital Media – creating, developing and marketing creative products in the forms of video games and virtual/augmented/mixed reality experiences, this industry leverages creative tech talent from developers to engineers, with a talent base with many similar and overlapping skills to those working in animation, VFX and post production.
Music + Sound Recording – creating, producing and marketing musical content, from recording and performing artists to the businesses that support them including record labels, music presenters, recording studios, event producers, venues, festivals and more.
Book Publishing – creating, producing and marketing literature in all forms, disseminated across traditional and digital platforms from print to e-books
Magazine Publishing – creating, producing and marketing long-form periodical journals – from lifestyle to literary to scientific content, online and in print.
Multi-Creative Industries – this segment emerged from the research, reflecting many companies and creators supplying skills and services to more than one creative industry.
Methodology
Updated for CIERA™ 2024 Release in March 2026
In 2019, Creative BC engaged Notio Media and Deetken Insight in a collaboration to design a bespoke mechanism of measurement for Creative BC to use annually, leveraging government datasets to track the economic impacts of each of the industries we serve and the creative industries in B.C. overall. Results from CIERA™ have been reported in each annual Impact Report since 2019/2020. The methodology is described here, including enhancements made for the 2024/25 report.
The methodology was designed to meet the following criteria: repeatability – the estimates can be updated and regularly and no less than annually; reliability – the data used to generate the estimates are from trusted sources and are well-documented; comparability – the estimates can be compared to those generated for other purposes (different sectors, regions, etc.); comprehensiveness – the data supports estimates that cover the full scope of economic impact (e.g. output, gross domestic product, employment); and alignment – the data supports estimates that align to the particular scope at hand, in this case, the B.C. creative sector.
Approach
The approach to build CIERA™ involved: 1) establishing industry scope by mapping North American Industry Classification System (NAICS) codes against a standard three-part value chain for each of the industries (creation>production>distribution); 2) assembling publicly available government data required to generate economic impact results for each industry, and 3) designing a tool to calculate output, gross domestic product (GDP), and employment each year that is easily updated as government datasets are refreshed and released.
A core component of the methodology is the Provincial and Territorial Culture Indicators (PTCI) and the Culture Satellite Account (CSA) on which the indicators are based. The CSA is a product of both the Canadian Framework for Culture Statistics (CFCS) and the Canadian System of Macroeconomic Accounts (CSMA): the CFCS provides the guiding principles to define and identify cultural economic activity by culture domain and subdomain, while the CSMA provides the mechanism and data to derive the PTCI. CIERA™ uses the “industry perspective” version of the PTCI which represents all economic activity associated with those industries included within the CFCS.
The PTCI include results by culture domain and subdomain* for output, gross domestic product (GDP), and jobs. Output is the value of the goods or services that are produced within an establishment that become available for use outside that establishment (or, in some special cases, within the producing establishment) and is net of subsidies** received. GDP represents an industry’s “value-add”, which is equal to the difference between an industry’s output and the cost of the intermediate inputs that are used up in the production of their goods and services. GDP is valued in basic prices, which means it excludes the taxes an industry pays on expenditures of intermediate inputs used in the production of goods and services. Both GDP and output are expressed in nominal terms and therefore reflect prices in a given period (as opposed to real values which are adjusted for inflation). Jobs refers to an industry’s total number of jobs. If a job exists for only part of the year, it counts as a job for the portion of the year it existed (e.g., 3 months = 1/4 of a job). However, a part-time job is valued the same as a full-time job (i.e., both are considered one job).
Statistics Canada provides a mapping of CSA domains and subdomains to industries based on the 2007 version of the North American Industry Classification System (NAICS). This mapping is done at the most detailed 6-digit level. NAICS Canada 2017 Version 2.0 was reviewed by Notio and Deetken with industry stakeholders to select the relevant industry codes to include in CIERA™ that best represent the creative industries that Creative BC serves. Concordances between NAICS versions were used to backwards-map 2017 NAICS to 2007 NAICS codes.
Additional data from Statistics Canada’s Business Register (BR) is used to allocate the PTCI to in-scope 6-digit NAICS and thus to the Creative BC industries. The BR reports the number of businesses that have employees within a certain range (e.g. 1-4, 5-9, 10-19, etc.) by 6-digit NAICS industry. The total employment count for a given NAICS industry is estimated by first multiplying the midpoint of each employment range by its corresponding number of businesses and then summing across all employment ranges. (Note that the PTCI results reflect the jurisdiction where business activity occurs whereas BR data reflect the jurisdiction in which a business is registered. The BR data, therefore, is used in CIERA™ as a proxy for where business activity occurred.)
This BR data, combined with output data by industry from Statistics Canada’s Supply and Use Tables (SUTs), is used to apportion PTCI results to a given Creative BC industry. The SUTs include a wide range of each Input-Output Industry Classification (IOIC) industry, including total output. The IOIC system is a special aggregation of NAICS. A mapping between these two systems allows for output to be estimated for 6-digit NAICS industries. Estimated employment counts for each NAICS industry are mapped to their corresponding IOIC industries and summed to derive output-per-employee benchmarks for relevant IOIC industries. These benchmarks are, in turn, used to estimate output per 6-digit NAICS industry, and these results are used to apportion PTCI results to a given Creative BC industry.
PTCI data reflects the direct economic impact of the culture industries, that is, the immediate economic activity of those businesses within the culture industries. Statistics Canada’s input-output multipliers are used to estimate corresponding indirect and induced impacts for a given IOIC industry. The indirect impact reflects the demand from culture industries for intermediate inputs from other industries. Indirect impact is cumulative, meaning it includes transactions going all the way back to the beginning of the supply chain. The induced impact reflects the attributable economic activity that arises as a result of industry workers, involved in either the direct or indirect activity, spending part of their wages and salaries on other goods and services.
CIERA™ makes adjustments to the indirect and induced multipliers that are published by Statistics Canada as follows:
- Indirect multipliers: These multipliers are adjusted downward to account for “own-indirect” activity, that is, supplier activity from the same industry. Not adjusting for own-indirect activity leads to a form of double-counting between direct, indirect and induced effects. As such, indirect multipliers are adjusted downward to omit own-indirect activity that is already captured as direct activity. CIERA™ uses linkage data from Statistics Canada’s Symmetric Input-Output Tables (SIOTs) to determine multiplier adjustment factors for each industry.
- Induced multipliers: These multipliers are similarly adjusted downward to account for own-indirect activity. While indirect multipliers are adjusted based on total supplier purchases from the same industry, induced multipliers are adjusted based on that portion of own-industry purchases that goes to wages and salaries. The SIOTs are used to determine the proportion of output that is made up of wages and salaries for each supplier industry. The induced multipliers are adjusted downward to account for that proportion of total wages and salaries (including both direct wages and salaries and wages and salaries paid by suppliers) resulting from own-indirect activity.
CIERA™ generates two sets of indirect and induced results: one for “within-B.C.” and the other for “all-provinces”. The adjustments to the within-B.C. multipliers account for both international and interprovincial imports, while the adjustments to the all-provinces multipliers account for international imports only. CIERA™ results published in the 2024/25 Impact Report are based on the within-B.C. multipliers. 2016 data from the SUT, SIOT, and BR are used in CIERA™ to apportion the PTCI and adjust the multipliers. In other words, output-per-employee benchmarks and multiplier adjustment factors are derived using 2016 data and then used for all years in CIERA™.
To allow total economic activity (that is, the sum of direct, indirect, and induced activity) across each creative industry to be summed without double-counting, CIERA™ also produces “de-linked” multipliers that account for inter-industry linkages. Inter-industry linkages occur when one creative industry purchases from another. For example, the Motion Picture industry’s purchases of goods and services from the Music and Sound Recording industry are counted as indirect impacts attributable to the Motion Picture industry, but also as direct impacts for the Music and Sound Recording industry. De-linked multipliers are constructed by omitting such inter-industry purchases and can therefore be used to generate estimates of the creative industries’ de-linked total aggregate impacts that exclude any double counting that would otherwise occur when summing individual industry totals.
To produce estimates for 2024, CIERA™ utilizes historical datasets for GDP and jobs by industry, in combination with historical trends observed from CIERA™ results. For quality assurance purposes, different statistical model approaches were back tested and scored on their ability to forecast actual CIERA™ results from 2010 to 2023, with the best model being selected to generate the 2024 estimates.
For the Motion Picture industry, CIERA™ considers Statistics Canada data and multiple proprietary and other data to inform not only 2024 but also 2022 and 2023 estimates. For this year’s version of CIERA™, these datasets are: Creative BC Tax Credit Administration data; WorkSafeBC’s Annual Assessable Payroll data; ProdPro Live Action Scripted in B.C. volumes; consolidated payroll data from B.C.’s film unions; and data from the CMPA Profile 2025 report. These datasets demonstrate similar trends during the 2022-24 timeframe that are not observed in either the PTCI or other Statistics Canada data; specifically, they all exhibit a substantial decline in activity in 2023 followed by a rebound in 2024, whereas the Statistics Canada data (PTCI and other) see only a negligible decline in 2023. The common trend that is visible in these data aligns to industry’s observations that the industry experienced a noticeable contraction in 2023 resulting from writers’ and actors’ strikes, followed by a rebound in 2024. Furthermore, considering these datasets collectively, it appears likely the economic activity in sector experienced less of an increase from 2021 to 2022 than the PTCI and other Statistics Canada data would suggest.
Validating 2023 Estimates Against Actuals
The most recent version of the PTCI, released on June 3, 2025, includes results for 2010 through 2023. An analysis was undertaken to compare previous CIERA™ estimates for 2023 to the results derived from published 2023 figures in the latest PTCI (referred to as actuals). It was found that the previously estimated total direct GDP across all creative industries for 2023 was 20% lower in CIERA™ than the corresponding actual PTCI-based results. This difference is primarily due to the retroactive adjustments made by Statistics Canada to previously published PTCI figures for 2021 and 2022 across several in-scope subdomains. Correspondence with Statistics Canada indicates that new PTCI publications regularly include retroactive adjustments to the figures for the two most recent years of the previous publication (e.g., 2021 and 2022 were adjusted in the latest PTCI).
NAICS and IOIC code mapping Updated 2022, no change in 2024 – click to download
Limitations and Key Considerations
The following are limitations and/or key considerations with respect to the methodology:
- Information from Statistics Canada’s Business Register (BR) is used to derive estimates of employment for in-scope 6-digit NAICS codes. Per above, Business Register data is used to adjust PTCI data to produce results that align to the required industry scope by estimating employment based on business counts, which presumes that the midpoint of each employment range represents the average number of employees for all businesses within that group.
- Total economic impacts (i.e., the sum of direct, indirect and induced impacts) should not be summed across Creative BC industries to attempt to represent aggregate impacts because of double-counting across industries. For example, some direct activity in Music and Sound Recording would also be captured as indirect (supplier) activity attributable to Motion Picture. Instead, “de-linked” aggregate totals calculated with CIERA™ should be referenced.
- It is questionable to consider spending decisions as induced effects attributable to direct activity.
- A variety of Statistics Canada datasets are used in the methodology, the release schedules of which vary. Every attempt has been made to match the datasets by reported year.
- CIERA™ results should not be viewed as time series. Statistics Canada periodically refines its measurement methods and does not consistently revise published data about prior years. This year, Statistics Canada retroactively adjusted PTCI figures previously published for 2021 and 2022, which CIERA™ incorporates despite creating some drift from previous results.
- A limitation in applying the multipliers pertains to how well the IOIC codes align to the in-scope NAICS codes and culture subdomains. The better the alignment, the more dependable are the results generated by the multipliers. This alignment varies across the Creative BC industries.
- Jobs as a measure is not ideal for gig work, as it provides limited insight into the number of individuals working in an industry. “Jobs” reflects the average annual number of full- and part-time jobs in an industry.
- Figures for the most recent year need to be estimated. The following datasets are used to produce these estimates:
- PTCI, provincial, annual (Table: 36-10-0453-01)
- GDP by industry, provincial, annual (Table: 14-10-0202-01)
- Labour statistics by industry, provincial, annual (Table: 36-10-0489-01)
- Gross domestic product (GDP) at basic prices, by industry, provinces and territories, growth rates, inactive (x 1,000,000) (Table: 36-10-0402-02)
- For Motion Picture:
- Creative BC Tax Credit Administration Data, which captures tax credit application data on total production spending in B.C. for all productions with Principal Photography / Key Animation (PPKA) (similar to Motion Picture output, but excludes production activity that does not qualify for B.C.’s motion picture tax credit programs)
- WorkSafeBC Annual Assessable Payroll Data, which reports the total earnings of workers employed by all registered businesses across a variety of industries, including the Motion Picture Industry, each year.
- ProdPro Live Action Scripted in B.C. ProdPro is a commercial intelligence tool whose data comes from a mix of public sources (industry press, trade outlets, filings, state disclosures) plus direct verification by ProdPro’s team.
- Annual consolidated payroll data from B.C.-based film and television labour organizations.
- Annual B.C. production volume reported in CMPA Profile 2025.
- CIERA™ was updated in 2025 to deliver 2024 insights using the most recently available data, including: 2023 results from the PTCI, and 2021 IOIC multipliers. SUT and SIOT data from 2016 continue to be used as modelling benchmarks. CIERA™ uses 2016 BR for 2010 to 2016 data and 2017 BR for 2017+ data to match to corresponding NAICS versions. 2021 multipliers – the most recent available – are used to estimate indirect and induced impacts for 2021, 2022, and 2023.
*Statistics Canada definitions: The domains and subdomains are intended to be measurable, distinct and recognizable to data users. At their highest level, domains consist of an aggregation of activities, artistic disciplines, industries, products and occupations that are related and provide a useful level of analysis. In most cases, these higher-level domains may be comparable at the international level, while a subdomain may support analysis at a more discrete or detailed level. Core culture subdomains produce goods and services that are the result of creative artistic activity and whose main purpose is the transmission of an intellectual or cultural concept. Read more online: https://www150.statcan.gc.ca/n1/pub/87-542-x/2011002/s02-eng.htm
**Subsidies are netted out because they reduce the cost of certain inputs such as labour, while taxes on factors of production (e.g., property taxes) are added in because they are costs paid by the producer and are included in the final value of the product.
***Statistics makes retroactive adjustments to Real GDP and Jobs estimates for recent years as more information is received – similar to how the PTCI is retroactively adjusted each year. As such, 2024 Motion Picture data reported by Statistics Canada may be revised in the future to better reflect industry observations.
DISCLAIMER
The views, opinions, conclusions and/or recommendations expressed in these materials are those of the author(s). These materials do not necessarily reflect the official policy or position of the Government of British Columbia. The Government of British Columbia does not endorse, nor has it confirmed the validity of the information contained in these materials.
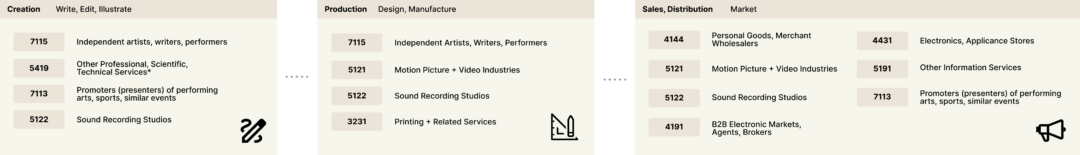
The Value Chains
CIERA™ maps business activity classified by Statistics Canada through what is known as the North American Industry Classification System (NAICS). These NAICS codes are attributed in full or in part to a three-part sector value chain: Creation > Production > Sales + Distribution.
Some of the “culture industries” as defined by Statistics Canada contribute to more than one creative industry; these NAICS cannot easily be attributed to a single creative industry, nor can their business activities be proportionally allocated. In these cases, their economic contributions have been aggregated into CIERA™’s Multi-Creative Industry figures. Outlined boxes in each graphic illustrate the codes that contribute to Multi-Creative Industry Services. See those impacts here.
Book Publishing

Interactive Digital Media

Magazine Publishing

Motion Picture

Multi-Creative Industry Services